יום שלישי, 22 במרץ 2022
יום ראשון, 13 במרץ 2022
International trade statistics: trends in fourth quarter 2021

Acceleration in merchandise trade bolsters recovery in G20 trade, but growth in services trade eases
24 Feb 2022 – Following a slow third quarter, G20 international merchandise trade accelerated in value terms in Q4 2021, partly due to high commodity prices, in particular for energy. While shipping costs kept the value of trade in transport services at record highs, trade in other services showed a slowdown notably in Europe, possibly reflecting a tightening of Covid-19 related restrictions towards the end of the year.
Growth in G20 international merchandise picked up in Q4 2021, with exports up 3.4% and imports up 5.0%, with respect to the previous quarter and measured in seasonally-adjusted current US dollars. This compares to the slower growth (1.5% for exports and 0.9% for imports) recorded in Q3 2021. Energy price increases continued to fuel merchandise trade growth in value terms, while pressure on supply chains, including for semiconductors, appears to have eased towards the end of the year.
Growth in exports and imports of services for the G20 is estimated at around 2.5% and 2.4% in Q4 2021, respectively, compared with the previous quarter and measured in seasonally-adjusted US dollars. The preliminary estimates compare to the rates of 3.8% and 3.5% recorded in Q3 2021 for exports and imports. Services trade continued to expand at a sustained pace in North America and most of East Asia, while growth slowed down in Europe.
In 2021, annual merchandise exports and imports for the G20 expanded by 25.9% and 26.1%, respectively, with values around 16% above their 2019 levels. While high commodity prices explain part of the increase, stimulus packages also played a role by spurring the demand for traded goods. Annual growth in exports and imports of services is estimated at around 15.0% and 11.3%, respectively. While transport costs skyrocketed, travel, which includes the expenditure of non-residents abroad, recovered but remained subdued. Trade in computer, business and financial services performed well across most of the G20 economies in 2021.
G20 merchandise trade
Based on figures in current prices (billion US dollars), seasonally adjusted
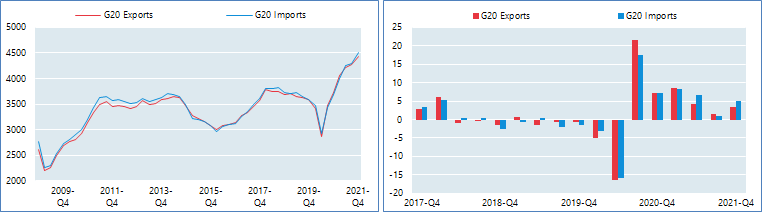
Visit the interactive OECD Data to explore these data further
A recovery in trade in vehicles and parts helped push merchandise trade growth in North America in Q4 2021, with exports from the United States (up 7.1%), Canada (up 6.7%) and Mexico (up 6.0%) all recording strong growth. Import growth for Canada (up 7.2%) and the United States (up 5.9%) was largely driven by higher purchases of home electronics and mobile phones.
Merchandise exports instead contracted in Argentina and Brazil (minus 7.3% and minus 5.0%, respectively), with lower shipments of metal ores and soybeans (mostly to China) weighing in particular on the Brazilian figures. Imports, on the other hand, expanded by 13.0% in Argentina and by 11.5% in Brazil, the latter driven by energy products, electrical machinery and fertilisers.
Merchandise trade picked up in Europe in Q4 2021, following the weak growth seen in Q3 2021. Exports and imports in the European Union (EU-27) expanded by 2.3% and 5.1%, respectively. All the major European G20 economies showed robust merchandise trade growth: France (exports and imports up 2.6% and 6.3%, respectively), Germany (up 2.2% and 5.8%) and Italy (up 2.5% and 4.5%), with higher purchases of energy products driving the import figures and trade in vehicles and parts recovering. Merchandise exports and imports of the United Kingdom expanded by 3.2% and 5.3%, respectively, with chemicals, machinery and transport equipment driving exports and energy products contributing to imports growth.
Electronics and vehicles (including e-cars) continued to spur exports growth for Korea (up 5.2%), while Japan saw more moderate growth in both exports (up 0.5%) and imports (up 2.2%). Chinese merchandise exports (up 4.6%) and imports (up 0.9%) rebounded in Q4 2021, after the much weaker figures in the previous quarter. Electronics and integrated circuits helped boost growth in exports, with integrated circuits also fuelling import growth along with soybeans and metal ores. India, with exports up 2.2% and imports up 10.7%, and Indonesia (up 8.9% and 13.1%), also posted solid merchandise trade figures in Q4 2021. Falling prices for metals and lower shipments of coal and fuels affected export growth for Australia (minus 3.5%), while imports expanded by 7.5%, largely driven by higher spending on vehicles, telecommunication equipment and home electronics. Exports from South Africa also contracted by 2.1% in Q4 2021, reflecting drops in its major exports of metal ores, fruits and electrical machinery, while imports increased by 3.3%.
In 2021 as a whole, merchandise trade values for the vast majority of the G20 members more than recovered the drops recorded in 2020. Exports and imports expanded by 23.1% and 21.3%, respectively, in the United States, with energy products and pharmaceuticals recording significant growth on the exports side. Similarly, annual exports and imports rose by 20.8% and 25.1% in the European Union. Electronics (integrated circuits, mobile phones, displays and computers) continued to propel merchandise exports from Korea (up 25.6%) and China (up 32.2%). Machinery and vehicles and parts contributed to total merchandise exports growth for Japan (up 18.3%), while imports increased by 21.3% over the year. Leading exporters of primary commodities benefitted from high demand and steep price increases, with merchandise exports soaring in 2021 for Russia (up 47.5%), India (up 42.1%), Indonesia (up 38.4%) and South Africa (up 44.9%).
G20 trade in services
Based on figures in current prices (billion US dollars), seasonally adjusted
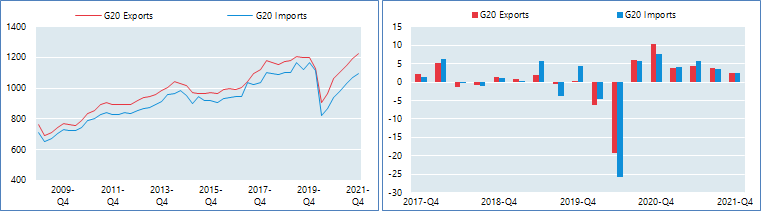
Visit the interactive OECD Data to explore these data further
Source: OECD Statistics and Data Directorate and national sources.
Note: the Q4 2021 trade in services values are preliminary estimates based on available data, covering about 60% of exports and imports for the G20 aggregate.
Services trade showed a mixed picture in Q4 2021. Following the expansion recorded in the previous two quarters, services trade in Europe slowed down in Q4 2021. Services exports increased by 1.8% in France, with weak sales of financial and insurance services partially offsetting growth in travel (up 15.9%) and transport (up 4.3%). German exports contracted by 2.3%, while imports increased moderately by 1.2%. The United Kingdom recorded a slowdown in both services exports (minus 2.4%) and imports (minus 2.5%), while exports and imports of Italy increased by 1.6% and 3.6%, respectively.
Turkey’strade in services continued to expand in Q4 2021. Exports grew by 4.0%, while imports rose by 8.0% reflecting strong purchases of computer and business services. Similarly, Russia’s services trade expanded markedly, with exports increasing by 8.4% and imports surging by 19.4%.
An easing of travel restrictions and high transport costs sustained trade in services growth in North America. The United States saw a 6.6% rise in services exports, with travel and transport up by 39.4% and 11.3% in Q4 2021. Imports grew more moderately by 4.3%. Similarly, Canada’s services exports and imports expanded by 6.5% and 6.1%, respectively, compared to the previous quarter.
Transport, computer and business services continued to boost trade in services growth across East Asia. Exports increased by 5.5% in Korea, with construction, of which Korea is a leading exporter, picking up strongly (up 55.9%) following three quarters of contraction. China also saw marked growth of 6.1% in services exports, fueled by higher sales of transport, computer and business services. Imports expanded by 4.6% in Korea and by 3.8% in China. Japan, on the contrary, experienced a decline in both services exports and imports (minus 3.9% and minus 5.0%, respectively), reflecting lower trade in all services but transport.
Owing to prolonged entry restrictions, which depressed travel receipts, services exports contracted further in Australia, recording a 4.9% fall in Q4 2021. However, services imports increased by 4.9% driven by transport (up 21.8%). In Brazil, services exports grew by 0.7%, while imports rose by 3.4% on higher purchases of business and transport services.
For 2021 as a whole, most G20 economies showed a robust rebound in trade in services compared to the previous year, although in many cases values remain below pre-crisis (2019) levels due to subdued travel figures.Exports of services from Korea and China, up 34.8% and 42.5% in the year, respectively, are an exception: soaring transport receipts, as well as buoyant figures across all services, drove total exports well above their 2019 levels. Japanese exports and imports expanded more moderately over the year (up 4.2% and 5.3%, respectively), while strict travel restrictions continued to weigh heavily on Australia’s services exports (down 8.4% compared to 2020). Services exports and imports increased by 8.6% and 16.2% in the United States, with financial and business services driving export growth, and transport and travel propelling import growth. In Europe, annual exports from France (up 18.0%), Germany (up 15.6%) and the United Kingdom (up 8.1%) were all close to their 2019 levels, largely reflecting dynamic trade in business and financial services. With travel receipts twice as high as in 2020 (but still 30% below their 2019 levels), Turkish exports of services jumped by 56.2% in 2021.
חוקי או לא חוקי

זכות העיכבון הינה זכות על פי דין, וכוונתה לייעל את הליך כריתתה של עסקה ולאפשר מסחר מהיר, דינמי ויעיל.
אך מה קורה כאשר סוכן האנייה מסרב למסור לסוכן המכס פקודת מסירה למטען של יבואן בשל חוב של סוכן המכס לסוכן האנייה מעסקה קודמת?
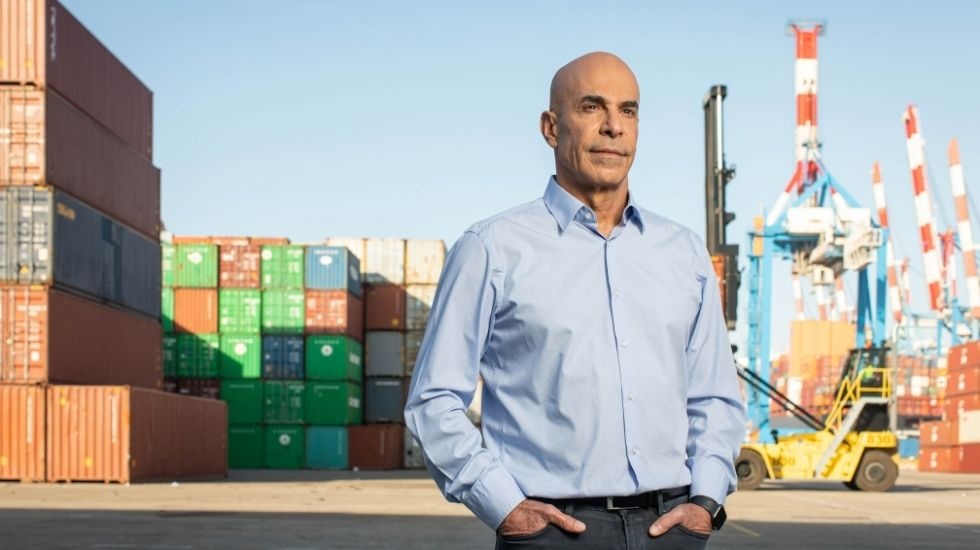
עו״ד גיל נדל על הנושא המרתק
בפרקטיקה של היבוא והיצוא ניתן להיתקל לא אחת במוביל ימי (או סוכנו) שמעכב סחורות ומסרב להנפיק פקודת מסירה בשל חובות כספיים. למשל, כאשר השולח לא שילם את דמי ההובלה של אותו משלוח, ועקב כך סוכן האנייה מסרב להנפיק פקודת מסירה. או, במקרה אחר, כאשר השולח חייב כסף בשל משלוחים קודמים, וסוכן האנייה תופס משלוח נוכחי (ששולמו עבורו דמי ההובלה) כ״בן ערובה״. לעיתים מעורב בעניין גם סוכן המכס: לדוגמא, כאשר סוכן האנייה מסרב למסור לסוכן המכס פקודת מסירה למטען של יבואן בשל חוב של סוכן המכס לסוכן האנייה מעסקה קודמת, או – במקרה חריף יותר – כאשר סוכן האנייה מסרב למסור לסוכן המכס פקודת מסירה למטען של יבואן א׳ בשל חוב כספי שיש ליבואן ב׳ כלפי המוביל (יבואן א׳ ויבואן ב׳ עובדים באמצעות אותו סוכן מכס, וכך מנסה סוכן האנייה לקשור ביניהם). זו, כאמור, התנהגות שניתן להיתקל בה בפרקטיקה, אולם אין זה אומר שזוהי התנהגות חוקית. אז מה החוק אומר בעניין זה?
זכות העיכבון הינה זכות על פי דין להפעלת סעד עצמי באופן המאפשר לבעל חוב להחזיק בנכס של חייב כערובה לתשלום החוב עד שיסולק, ללא כל צורך בפנייה לבית המשפט. זכות העיכבון בעצם נועדה לענות על צרכי המסחר של נותני שירותים וספקים שלא ניתן לדרוש מהם ׳לרוץ׳ בכל מתן שירות אל רשם המשכונות כדי לרשום משכון על נכסי החייב, ושעלולים להימנע מעשיית עסקאות בלא שיובטחו להם זכויותיהם מול החייב.
בכך, בעצם, מייעלת זכות העיכבון את הליך כריתתה של עסקה ומאפשרת מסחר מהיר, דינמי ויעיל.
זכות העיכבון יכולה להיווצר הן מכוח חוק והן מכוח הסכם בין הצדדים. ההסדר החקיקתי הכללי בדבר זכות העיכבון מקורו בחוק המטלטלין הקובע באופן כללי את דרך הפעלת הזכות, מהותה והיקפה. סעיף 11(א) לחוק המטלטלין קובע את זכות העיכבון מכוח החוק: ״עיכבון הוא זכות על פי דין לעכב נכס מטלטלין, כערובה לחיוב עד שיסולק החוב״. עם זאת, על מנת שלאדם תהא עילת שימוש בזכות העיכבון מכוח החוק, עליו להיכנס בשעריו של אחד החוקים הספציפיים המורים על זכות עיכבון ייחודית. כך, לדוגמה, קיימות הוראות עיכבון ספציפיות בסעיף 31 לחוק המכר, סעיף 5 לחוק הקבלנות, סעיף 12 לחוק השליחות, סעיף 8(ג) לחוק הנאמנות, סעיף 19 לחוק החוזים (תרופות) וכו׳.
פורסם באתר – www.port2port.co.il
יום ראשון, 6 במרץ 2022
תעלת סואץ: עלייה נוספת בתעריפי אגרות המעבר
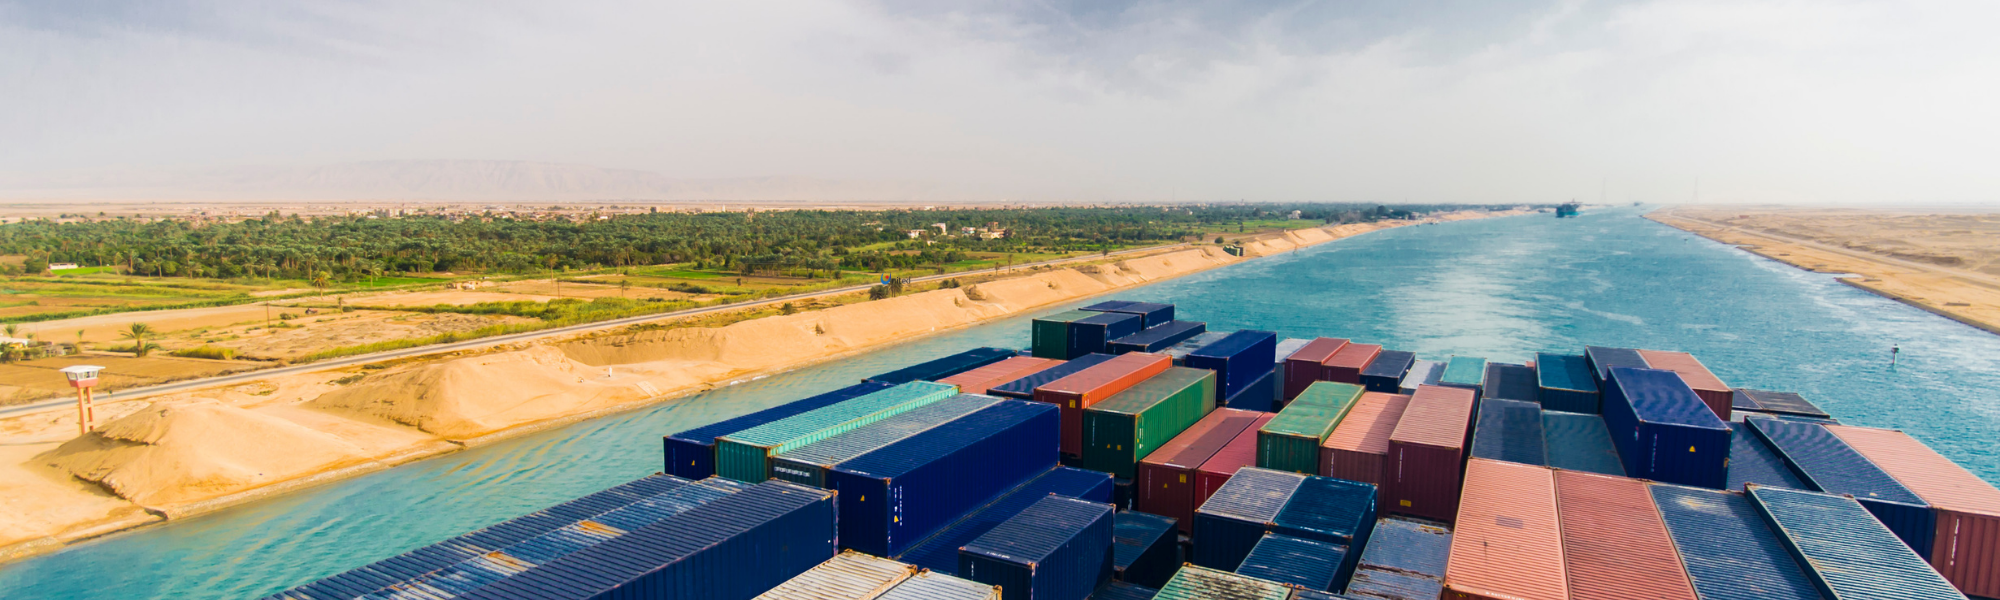
החל מה-1 במרץ מתייקרות אגרות המעבר בתעלת סואץ בשיעור של עד 10%. נזכיר כי ב-1 בפברואר כבר התייקרו האגרות בכ-6% לכל כלי השיט העוברים בתעלה, למעט ספינות נוסעים ומכליות גז.
החל מהיום (1/3) מתייקרות אגרות המעבר בתעלת סואץ בשיעור של עד 10%. רשות תעלת סואץ הודיעה על ההעלאה בשבת בלילה. נזכיר כי ב-1 בפברואר כבר התייקרו האגרות בכ-6% לכל כלי השיט העוברים בתעלה, למעט ספינות נוסעים ומכליות גז.
הרשות הסבירה שההחלטה התקבלה ״על סמך הצמיחה המרשימה בסחר העולמי, השיפור בענף הספנות, פיתוח מסלולי הניווט (בתעלה) ושיפור שירותי המעבר בתעלת סואץ״. מחירי האגרות שונים על פי סוג הספינות. כך למשל מכליות הנפט ומוצריו יצטרכו לשלם עוד 5% מהיום כדי לעבור בתעלה. על מכליות המובילות גז וכן על אניות המובילות מוצרים כימיים לשלם עוד 10% כדי לעבור בתעלה.
במצרים מעריכים כי ייקור האגרות לא ישפיע על התנועה בתעלה בייחוד בתקופה הנוכחית כשלכלי השיט אין ממש אלטרנטיבה עקב עליית מחירי הדלקים.
אתמול (2/3) החלה ״רשות תעלת סואץ״ המצרית ליישם את החלטתה לייקר את אגרות המעבר לכל סוגי הספינות העוברות בתעלה ב-6%, ואת למעט ספינות תיירים ומכליות גז נוזלי. בתחילת ינואר החלה הרשות לצמצם ההנחות שנעו בין 5% ל-10% שנתנה לקווי הספנות המשתמשים בנתיב השיט הבינלאומי.
״רשות התעלה״ נימקה את החלטתה להפחית את ההנחות עליהן הכריזה במהלך משבר הקורונה בכך שהיא ״מעוניינת להפיק תועלת מהגידול בתנועת השיט העולמית, במיוחד עבור ספינות מכולות, לאחר פתיחת הנמלים מחדש וחידוש העבודות בהם במלוא התפוקה״. תנועת הגז הנוזלי בתעלת סואץ מהווה כ-4.5% מסך תנועת הסחר העוברת בתעלה. במצרים הסבירו שהפטור לספינות הקרוז מדמי מעבר מוגדלים תואם מצבה של התיירות העולמית, שנפגעה קשות במהלך השנתיים האחרונות עקב התפשטות הקורונה בעולם.
במקביל, אוסמה רביע, ראש רשות התעלה אמר אתמול שבמהלך חודש ינואר 2021 הגיעה תנועת הספינות בתעלה ל-1,774, עלייה של 11% לעומת השנה שעברה. רביע הוסיף בראיון לתכנית טלוויזיה שהתעלה השיגה בחודש ינואר הכנסה בשווי של 544 מיליון דולר, עלייה של 10% לעומת השנה שעברה.
פורסם באתר – www.port2port.co.il
יום רביעי, 2 במרץ 2022
יחדיו שילוח בינלאומי ועמילות מכס בע"מ

יום שלישי, 1 במרץ 2022
אתר נמל אשדוד: דו״ח מתעדכן בזמן אמת של תפוקות אניות ומנופים למכולות
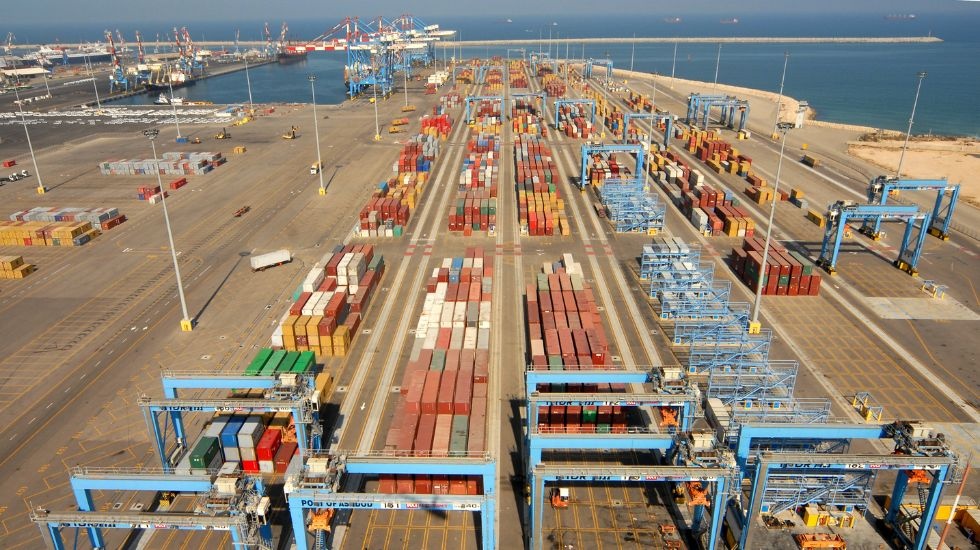
הנתונים החדשים זמינים לכלל האוכלוסייה ומספקים את כל המידע אודות
פריקה וטעינה של מכולות בנמל, כולל ממוצעי ביצוע לכל אנייה ולכל עגורן.
שוקי ז׳אנה, מנכ״ל חברת נמל אשדוד: אנו רואים חשיבות עליונה בהגברת
השקיפות. בעתיד נאפשר יכולת זו גם למטען כללי.
נמל אשדוד הוסיף עמוד חדש לאתר האינטרנט של הנמל, בעמוד זה ניתן יהיה למצוא דו״ח תפוקות אניות ומנופים למכולות המתעדכן בזמן אמת. כל המידע הרלוונטי אודות פריקה וטעינה של מכולות בנמל אשדוד, כולל ממוצעי ביצוע לכל אוניה ולכל עגורן.
הדו״ח פתוח לכלל האוכלוסייה ומאפשר לציבור הרחב לעקוב בזמן אמת בנתוני הפריקה והטעינה בנמל אשדוד. בנוסף, עבור כל אנייה הנכנסת לנמל אשדוד ניתן יהיה לקבל נתונים הכוללים את סוכן האנייה, קו האניות במסגרתו האנייה פועלת, מועד קשירת האנייה לרציף, מועד תחילת העבודה על האנייה. כמו כן, ניתן לעקוב אחר סך המכולות המתוכננות לפריקה וטעינה, מספר המכולות שנטענו ונפרקו בפועל, אחוז העבודה שהושלמה וקצב הפעולות הממוצע לשעת אנייה ולמשמרת.
הדו״ח לא מספק מידע רק על האניות, אלא גם על העגורנים העובדים על האניות. בכל דו״ח ניתן יהיה למצוא פירוט על קצב עבודת העגורן, מספר המכולות שפרק כל עגורן במהלך המשמרת, וכן מתי החל וסיים לעבוד. שירות נוסף הניתן בדו״ח החדש הינו תצורת מבנה המחסנים בבטן האנייה ונתונים נוספים עבור כל מחסן בנפרד.
לקישור לחצו על התמונה

יום ראשון, 27 בפברואר 2022

יום רביעי, 16 בפברואר 2022
נמל אשדוד: אניות נפרקות בחלקו המזרחי של רציף 21
נמל אשדוד האיץ סיום עבודות השדרוג בחלקו המזרחי של רציף 21 באורך שך כ-320 מטר, ומאפשר כעת פריקת אניות כחלק מהתמודדות עם העומס.
יום ראשון, 13 בפברואר 2022
נמל חיפה מעדכן כלפי מעלה את תחזית המטענים לשנת 2022
על פי הערכות מחודשות בנמל חיפה הצפי הוא כי כמות המכולות שתעבור בנמל בפועל בשנת 2022 גבוהה בלמעלה מ-125 אלף מכולות מהתכנון המקורי. בכוונת חברת הנמל לקלוט 50 עובדים נוספים ולהאריך את העסקתם של 40 עובדים זמניים שכבר נקלטו.
יום רביעי, 9 בפברואר 2022
הסכסוך בנמלים: בית הדין לעבודה ישוב ויתכנס באפריל

סגן נשיאת בית הדין הארצי לעבודה, השופט אילן איטח, הודיע כי ב-10 באפריל יתקיים דיון בהליך המאוחד העיקרי. בית הדין הארצי לעבודה נעתר לבקשת התאחדות התעשיינים ואיגוד לשכות המסחר והוציא צו מניעה נגד סכסוך העבודה שהכריזה ההסתדרות
יום ראשון, 6 בפברואר 2022
מדד פרייטוס: עלייה של 20% בתעריפי ההובלה האווירית מאירופה לאסיה
תעריפי ההובלה הימית בין אסיה והחוף המערבי של ארה״ב ירדו ב-2% ל-$15,218/FEU, וזאת באופן שונה מהמתרחש לפני ראש השנה הסיני. שיעור זה גבוה ב-169% מהתקופה המקבילה אשתקד.
הירשם ל-
רשומות (Atom)